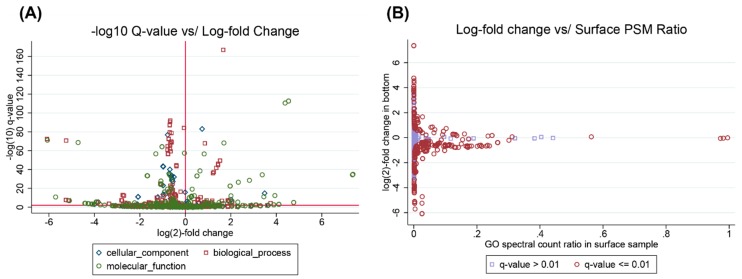
Figure 4.
GO term statistics produced by a MetaGOmics analysis comparing ocean surface to bottom water samples from May et al. All data from the analysis are available at https://www.yeastrc.org/metagomics/ocean. (A) Volcano plot depicting the negative log (base 10) of the q-value versus the log (base 2) fold change for all GO terms found in either sample. A horizontal reference line is added for a q-value cutoff of 0.01. A vertical reference line is added for no change. Each point is a GO term and has been colored and re-shaped according to its GO aspect; (B) A scatter plot depicting the log (base 2) fold change from the surface sample to the bottom sample for each GO term versus that GO term’s spectral count ratio in the surface sample. Each GO term has been colored either lavender (not statistically significant) or red (q-value ≤ 0.01).

