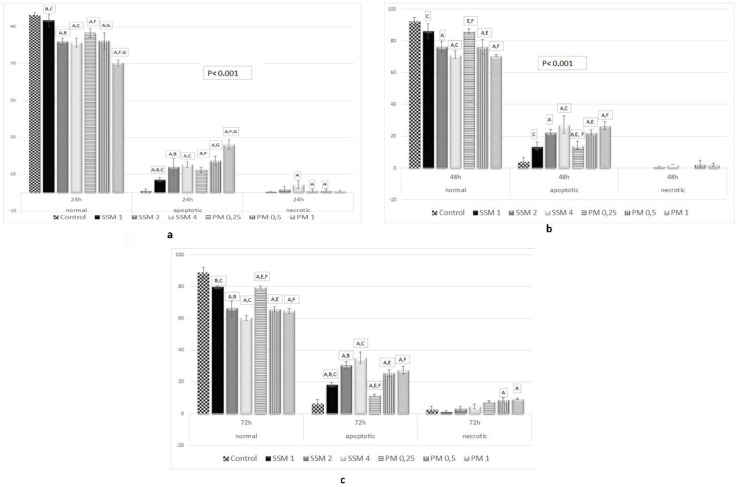
Figure 8.
Apoptotic and necrotic activity of SSM and PM on L-929 cell lines. Cells were treated with different concentrations of SSM and PM for 24 (up, left, a), 48 (up, right, b) and 72 h (below middle, c), AO/EB double staining and measured by fluorimetery. There were positive correlations between cell viability ratios obtained from cytotoxicity assays and cell death (apoptosis + necrosis) ratios obtained from AO/EB assay. Significant differences between cell death ratios at 24, 48 and 72 h were indicated by p < 0.05 as: A: Significant differences between cell death at control and cells treated with related Nano-micelles B: Significant differences between 1 mg/mL and 2 mg/mL SSM, C: Significant differences between 1 mg/mL and 4 mg/mL SSM, D: Significant differences between 2 mg/mL and 4 mg/mL SSM, E: Significant differences between 0.25 mg/mL and 0.5 mg/mL PM, F: Significant differences between 0.25 mg/mL and 1 mg/mL PM, G: Significant differences between 0.25 mg/mL and 1 mg/mL PM.

