
Fig. 2.
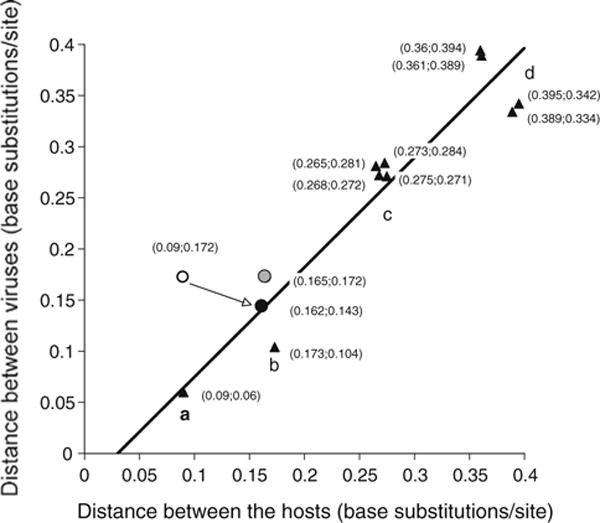
Correlation of evolutionary distance between primate simplexviruses and their host species. The nucleotide sequences of UL30 ORF of HSV2, ChHV, HVP2, BV and SQHV were aligned, and pairwise distances were plotted against pairwise distances of aligned mitochondrial genomes of the putative hosts in these combinations (triangles): a ChHV/HSV2 vs. Pan/Homo; b HVP2/BV vs. Papio/Macaca; c BV/other viruses vs. Macaca/other hosts; d SQHV/other viruses vs. Saimiri/other hosts. The regression line has a slope of 1.07 and an R2 value of 0.90. The open circle represents the pairs HSV1/ChHV vs. Homo/Pan, the solid circle represents the pairs HSV1/HSV2 vs. Pongo/Homo, and the gray circle represents the pairs ChHV/HSV1 vs. Pan/Pongo (color figure online)