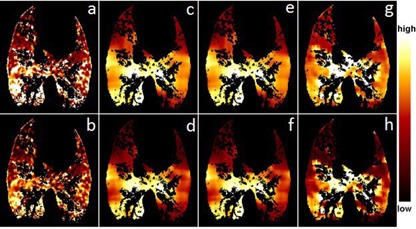
Figure 2.

Ventilation distribution comparison between the XeCT and ΔV methods for the worst case: (a) absolute ventilation by Xe, (b) percentile distribution by Xe, (c) absolute ventilation by ΔV, (d) percentile distribution by ΔV, (e) absolute ventilation by Jacobian, (f) percentile distribution by Jacobian, (g) absolute ventilation by HU and (h) percentile distribution by HU. The averaging filter sizes used in this figure were 3 for the ΔV and Jacobian methods and 3 for the HU method.
