
Figure 3.
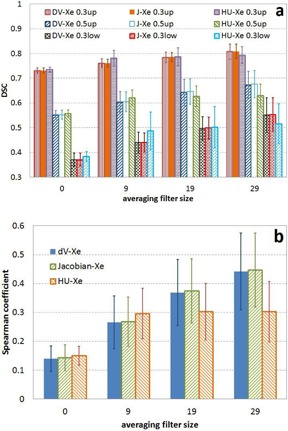
Mean Dice similarity coefficient (a) vs. averaging filter size and (b) mean Spearman coefficient vs. averaging filter size over the four cases between XeCT ventilation distribution and ventilation distributions calculated using 4D CT.
Official websites use .gov
A
.gov website belongs to an official
government organization in the United States.
Secure .gov websites use HTTPS
A lock (
) or https:// means you've safely
connected to the .gov website. Share sensitive
information only on official, secure websites.
Mean Dice similarity coefficient (a) vs. averaging filter size and (b) mean Spearman coefficient vs. averaging filter size over the four cases between XeCT ventilation distribution and ventilation distributions calculated using 4D CT.