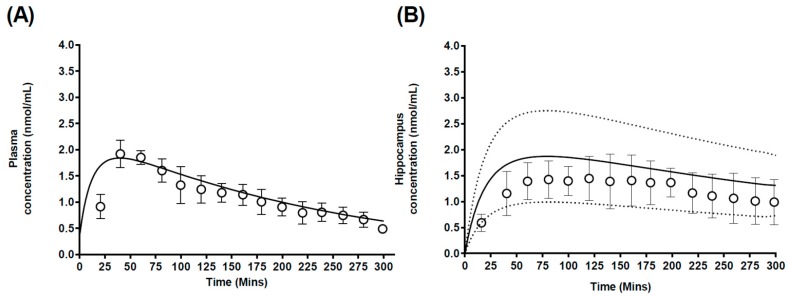
Figure 6.
Simulated mean carbamazepine plasma and hippocampus concentration-time profiles. Simulated mean values of carbamazepine-time profiles in (A) plasma and (B) hippocampus after a 2.5 mg/kg carbamazepine dose. Open circles and errors bars represent literature reported mean and ±SD. Solid black line represents model prediction mean profiles and dashed lines indicated 95th and 5th percentiles.

