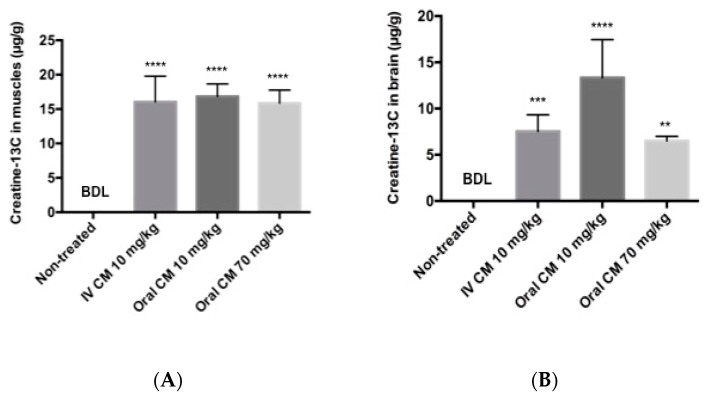
Figure 4.
(A) Muscle and (B) brain concentrations of Creatine-13C 4 h after administration of CM-13C. Values represent the mean ± SEM. Creatine-13C content in muscle and brain samples from non-treated rats was below detection limits (0.5 μg/g tissue). n = 4 rats. ** p < 0.01, *** p < 0.001, **** p < 0.0001 compared to levels in non-treated group. BDL = below detection limit.

