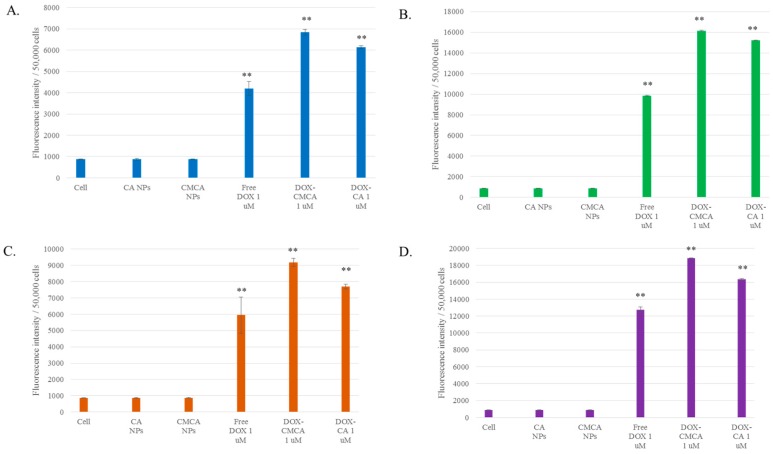
Figure 8.
Cellular uptake of free DOX, DOX-CA NPs and DOX-CMCA NPs. (A) fluorescence intensity measuring DOX (1 µM) uptake with MCF-7 cells at 1 h of treatment; (B) fluorescence intensity measuring DOX (5 µM) uptake with MCF-7 cells at 1 h of treatment; (C) fluorescence intensity measuring DOX (1 µM) uptake with MCF-7 cells at 4 h of treatment; (D) fluorescence intensity measuring DOX (5 µM) uptake with MCF-7 cells at 4 h of treatment. Values were significant (*) at p-value < 0.05, extremely significant (**) at p-value < 0.0001 vs. untreated cells at CI of 95%.

