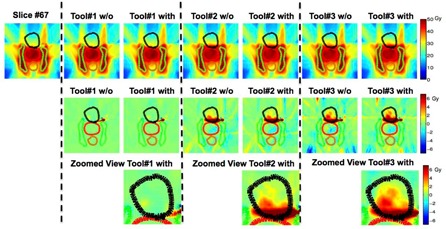
Figure 4.

One axial slice view showing the prostate case among all three algorithms without (w/o) or with adding Gaussian‐type noise. All contour colors match with corresponding DVHs in Fig. 3. The absolute dose distribution is shown on the top row, while dose difference in Gy compared to the “reference” is shown on second row with a zoomed view of the prostate (PTV) region on the bottom.
