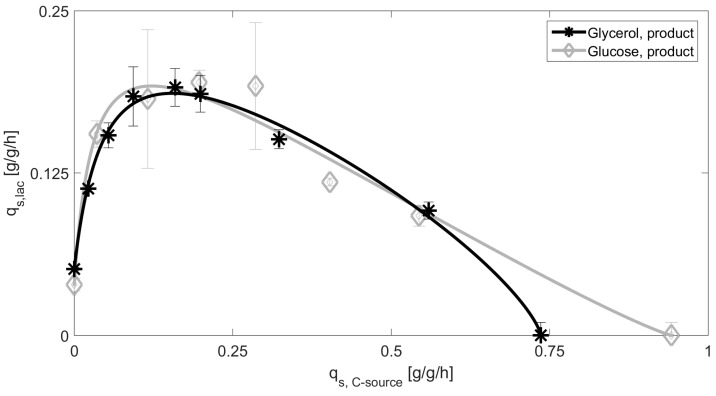
Figure 1.
Extracted datapoints for qs values including standard deviations for cultivations with glucose and glycerol in the production strain (glycerol product, glucose product). Solid lines represent the model based approach for inducer uptake rates vs. feeding rates models of glucose and glycerol.

