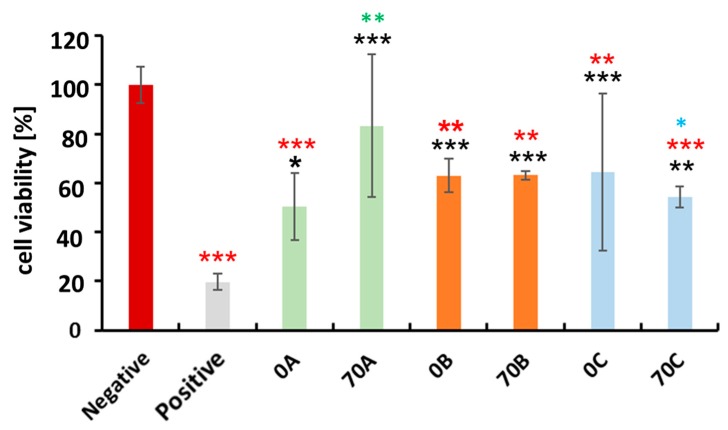
Figure 6.
Human breast adenocarcinoma (MDA-MB-231) cytocompatibility with 0A, 70A, 0B, 70B, and 0C, 70C chitosan–cellulose hydrogel beads over the timeframe of 48 h. Values are expressed as percentage of the means ± SD (n = 4). Statistical significance was defined as * p < 0.05, ** p < 0.01, *** p < 0.005 compared to control samples (ANOVA test). Black * and red * indicates sample comparison to positive and negative control respectively. While green * shows comparison between 0A and 70A, 0B and 70B, 0C and 70C; blue * shows between 70A and 70B, 70A and 70C, 70B and 70C.

