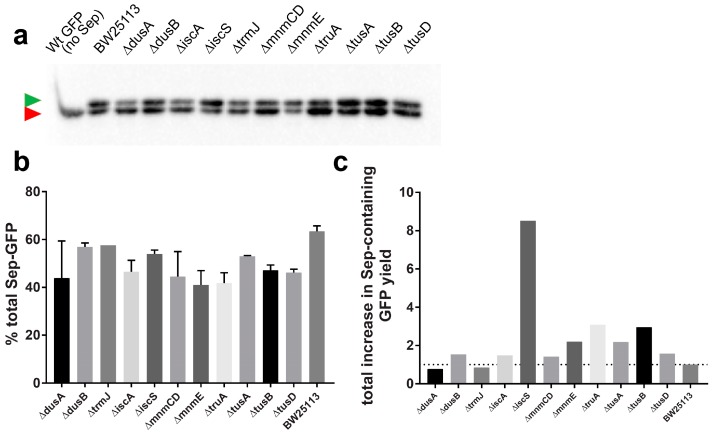
Figure 4.
Some of the deletion strains showing increased GFP-2TAG synthesis while preserving the relative Sep-GFP to cAA-GFP ratio. (a) Phos-tagTM mobility shift analysis of GFP-2TAG isolated from the corresponding knockout strains. Strain names are indicated above the wells. Proteins were analyzed by the Phos-tag method and detected by Western blot using anti-GFP antibodies. The green arrow shows the position of the Sep-containing GFP, while the red one points to the position of nonphosphorylated, cAA-containing GFP. Wild-type GFP controls are also shown. (b) Quantification of the shifted bands allows the estimation of Sep incorporation efficiency. Percentages of Sep-modified GFP in the corresponding isolate are shown. Values are presented as mean ± S.D. derived from two biological replicates. (c) Mean increase in total GFP-2TAG synthesis (Figure 3, Supplementary Figure S3 and Table S3) multiplied by the mean percentage of Sep-containing GFP in the matching strain shows the factual increase in Sep-GFP production.

