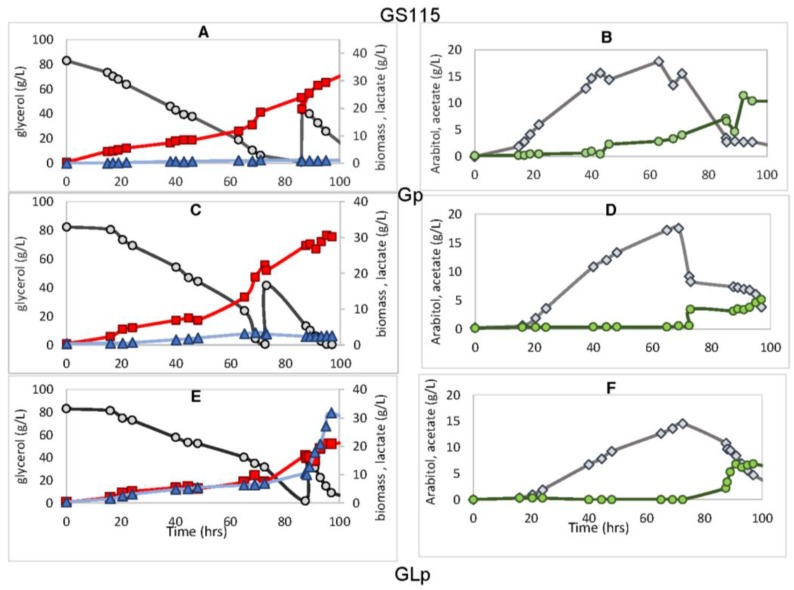
Figure 3.
Fermentation profile of the strains GS115 (A,B), Gp (C,D), and GLp (E,F) showing consumption of glycerol (gray circle) and the production of biomass (red square), lactate (blue triangle), arabitol (gray diamond) and acetate (green circle). 4% glycerol was added at 70–80 fermentation hours when oxygen was limited. Experiments were performed in biological triplicates, and the figure shows a typical fermentation profile.

