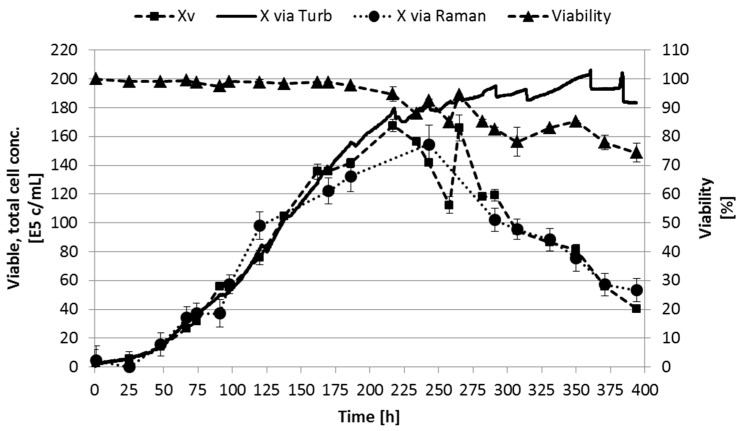
Figure 7.
Viable and total cell concentration based on Raman spectroscopy coupled to PLS and turbidity, respectively, compared to experimental viable cell concentration. Error bars represent the double determination of cell concentration and viability, as well as the model error of PLS (RMSE ≤ 13.82).

