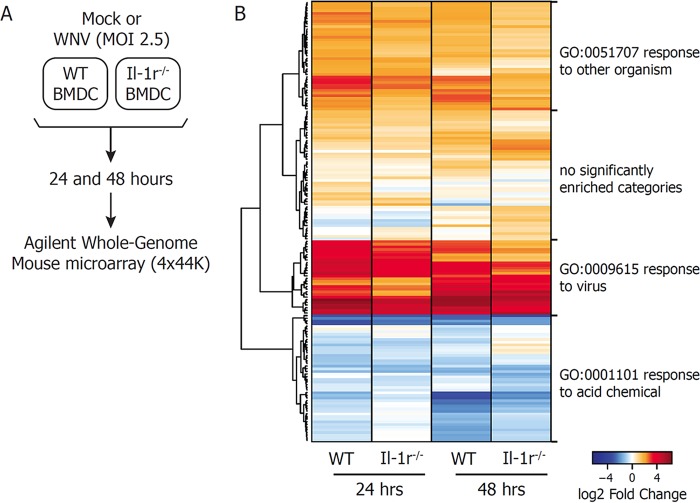
FIG 2 .
Genome-wide expression analysis of IL-1R-regulated genes. (A) Schematic diagram of the microarray design used in this study. WT or Il-1r−/− BMDCs were mock infected or infected with WNV at an MOI of 2.5. Total RNA was extracted at 24 and 48 h p.i. and subjected to Agilent Whole Mouse Genome Microarray analysis. (B) Gene expression levels were determined as fold changes with respect to matched, mock-treated controls. A significant change is defined as a >1.5-fold increase or decrease with respect to mock treatment, with a BH-adjusted P value of <0.05. IL-1R-regulated genes were defined as those whose fold changes with respect to mock treatment in Il-1r−/− BMDCs were >1.5-fold decreases compared with WT cells, with a BH-adjusted P value of <0.05. WNV-induced expression of IL-1R-regulated genes was plotted on a heat map with hierarchical clustering by Euclidean distance. Gene clusters are labeled with the most significantly enriched biological process in that group.

