
FIG 3 .
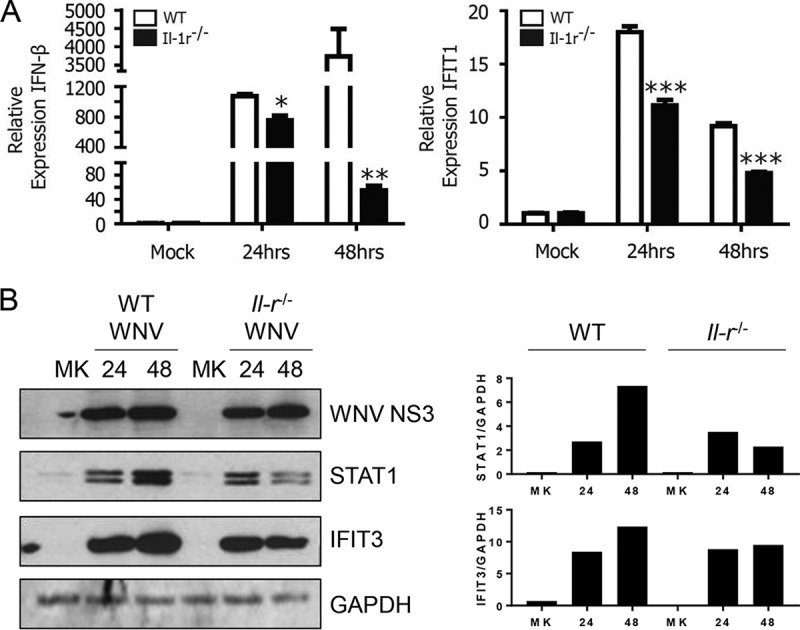
IL-1 signaling enhances antiviral responses. (A) WT or Il-1r−/− BMDCs were mock infected or infected with WNV at an MOI of 2.5. Expression of IFN-β and IFIT1 was measured by qRT-PCR at 24 and 48 h p.i. relative to that in matched, mock-treated controls. (B) Total cell WNV NS3, STAT1, and IFIT3 protein levels were measured by immunoblotting with GAPDH as a loading control (left). Densitometry analyses of STAT1 and IFIT3 protein abundance were compared against GAPDH abundance for each condition (right). The data are the averages of three independent experiments. Asterisks indicate values that are statistically significantly different between WT and Il-1r−/− cells by unpaired t test (*, P < 0.05; **, P < 0.01; ***, P < 0.001). MK, mock treatment.