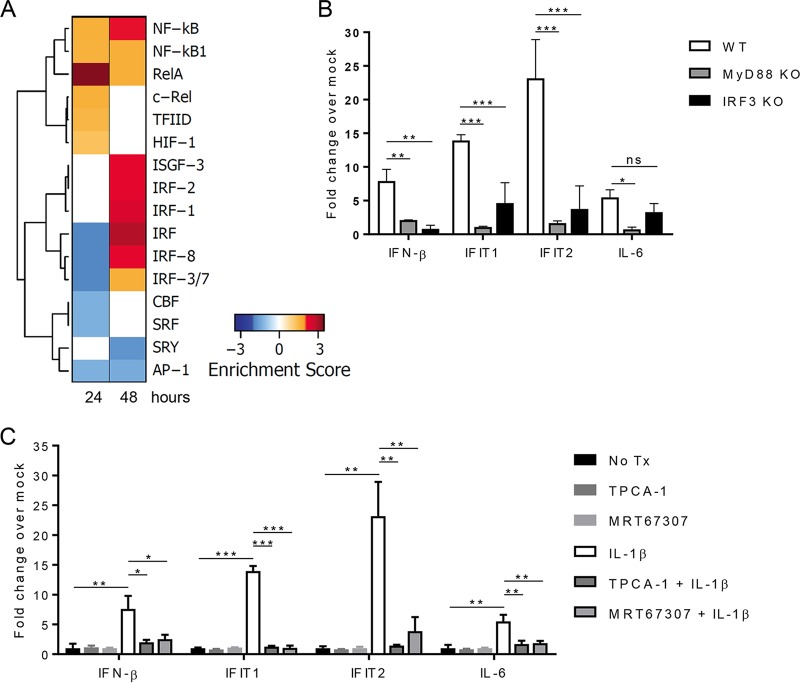
FIG 5 .
Signaling requirements of IL-1β-driven ISG responses. (A) Genes upregulated (red) or downregulated (blue) after 24 or 48 h of IL-1β treatment were assessed for enriched transcription factor binding sites (UCSC Genome Browser PWM in Enrichr [41, 74]). Significantly enriched sites are considered those with an adjusted P value of <0.05. Enrichment scores are defined as the negative log of the adjusted P value. (B) WT, Myd88−/−, and Irf3−/− BMDCs were mock treated or treated with IL-1β (100 ng/ml) for 48 h. Gene expression levels were measured by qRT-PCR and are displayed relative to those of matched, mock-treated controls. (C) WT BMDCs were mock treated (No Tx) or pretreated with the IKKβ inhibitor TPCA-1 (50 nM) or the TBK1/IKKε inhibitor MRT67307 (2 µM) for 1 h and then mock treated or treated with IL-1β (100 ng/ml) for 48 h. The data are averages of three independent experiments and represent fold changes with respect to respective mock-treated controls. Asterisks indicate values that are statistically significantly different between WT and Myd88−/− or WT and Irf3−/− cells (B) or between treatment groups and mock-treated cells (C) by unpaired t test (*, P < 0.05; **, P < 0.01; ***, P < 0.001).

