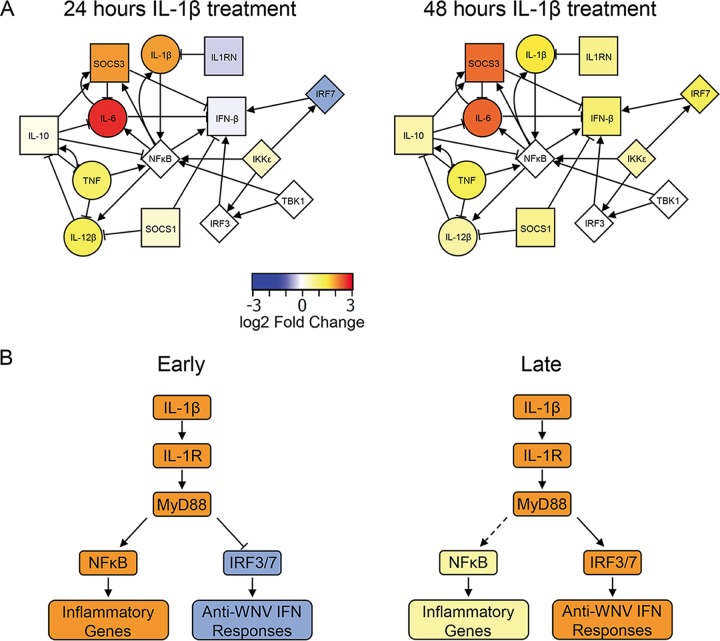
FIG 6 .
Model of IL-1β-driven ISG responses. (A) Network analysis of inflammatory and anti-inflammatory genes during IL-1β treatment. Nodes represent either genes induced by IL-1β treatment or signaling molecules and transcription factors regulating their expression. Circular nodes are considered inflammatory, whereas square nodes are considered anti-inflammatory. Diamond-shaped nodes represent signaling molecules and transcription factors involved in this network. Edges between nodes were curated from the InnateDB database (71) and represent either activation (arrows) or inhibition (bars). Node fill colors represent log2-fold changes in expression following IL-1β treatment with respect to mock-treated cells at the times indicated. (B) Model of IL-1β responses in BMDCs. At early times after IL-1β exposure, signaling to NF-κB leads to upregulation of inflammation-related genes while signaling to IRF3 and IRF7 is inhibited. At later times, the inflammatory response is dampened by IRF activation, leading to induction of an anti-inflammatory response. This anti-inflammatory response includes type I IFN and other antiviral genes that promote the maintenance of antiviral responses during WNV infection.

