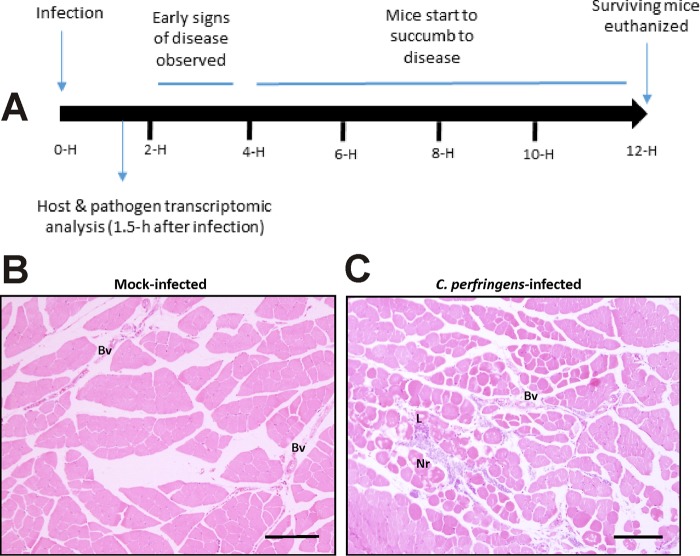
FIG 1 .
Disease progression in a mouse myonecrosis model. (A) The diagram shows the normal course of disease progression, with the time after infection shown in hours (H). In this study, samples were taken after 1.5 h, before significant clinical signs were observed. (B and C) Mock-infected muscle tissue (B) and C. perfringens-infected tissue (C) are shown stained with hematoxylin and eosin 1.5 h after infection. Bars, 10 µm. Bv, blood vessels; Nr, necrotic tissue; L, leukocytes.

