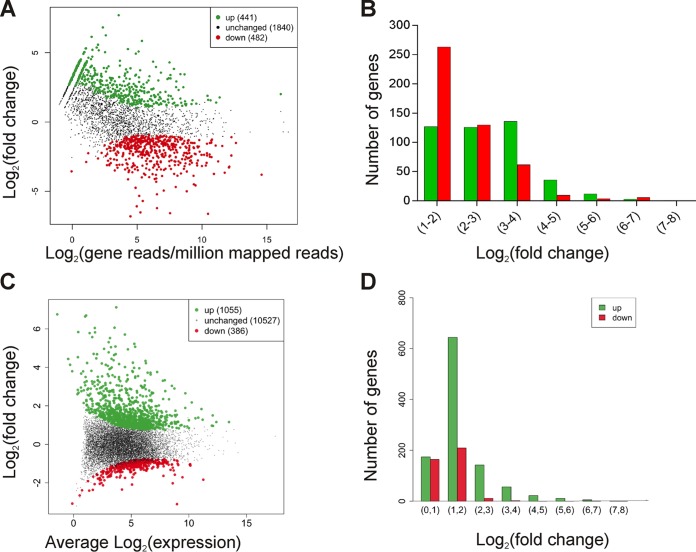
FIG 2 .
Relative levels of expression of host and C. perfringens genes. (A) Differentially expressed genes in C. perfringens JIR325 cells cultured in vivo compared to in vitro, as analyzed by the DESeq R package (87). Each point represents a gene. (B) Proportions of differentially expressed C. perfringens genes relative to their altered levels of expression. [FDR, <0.01; log2(fold change), >1]. (C) Differential expression of host genes as analyzed by the DESeq R package. Each point represents a separate gene. (D) Proportions of differentially expressed host genes relative to their altered levels of gene expression. [FDR, <0.01; log2(fold change), >2]. In all graphs, green dots and bars represent significantly upregulated genes and red dots and bars represent significantly downregulated genes.

