FIG 4 .

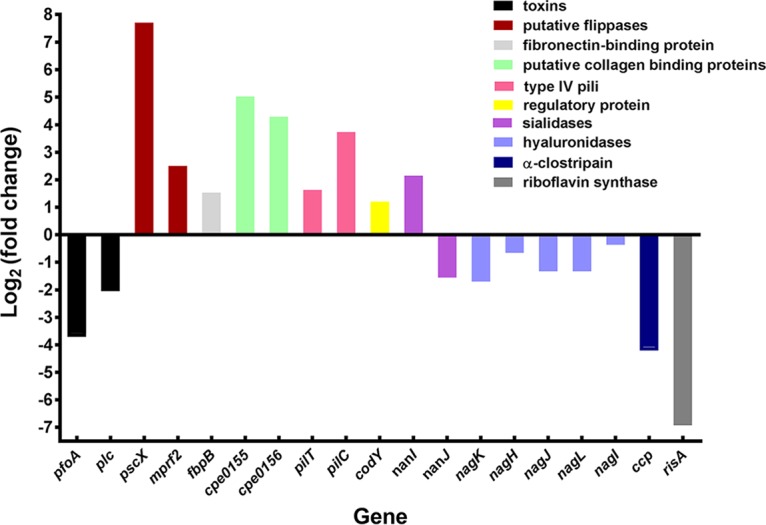
Comparative expression ratios (in vivo versus in vitro) of genes encoding toxins and potential virulence-associated factors. Refer to Table S3 for details and locus tag data.

Comparative expression ratios (in vivo versus in vitro) of genes encoding toxins and potential virulence-associated factors. Refer to Table S3 for details and locus tag data.