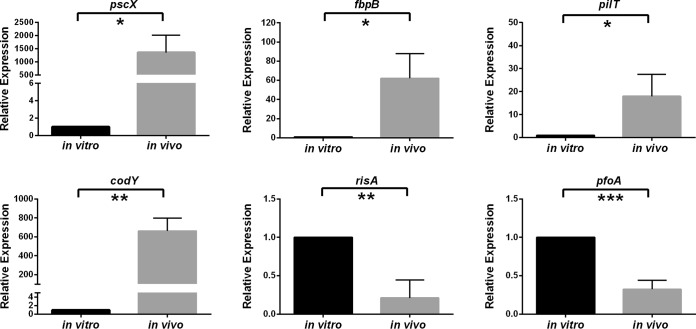
FIG 5 .
qRT-PCR analysis of selected bacterial genes. Expression levels in cells grown in vitro and in vivo are shown relative to the respective levels of rpoA expression. Values represent means ± standard errors of the means (SEM) of results from three independent biological replicates. Statistically significant differences (P ≤ 0.05 by unpaired t test) are denoted by asterisks as follows: *, P ≤ 0.05; **, P ≤ 0.01; ***, P ≤ 0.001.

