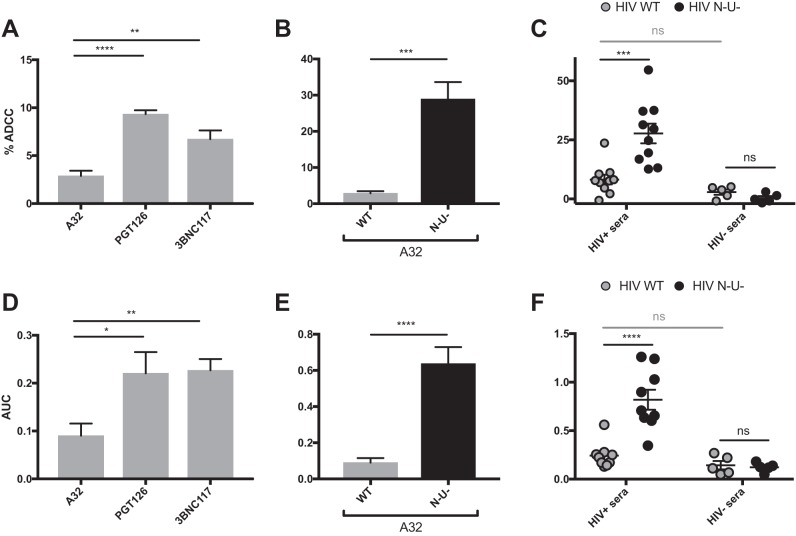
FIG 2 .
ADCC responses detected with assays measuring the elimination of infected cells. Primary CD4+ T cells (A to C) or CEM.NKr-CCR5-sLTR-Luc cells (D to F) infected with the NL4.3 ADA GFP virus, either wild-type (HIV WT) (depicted in gray) or defective for Nef and Vpu expression (HIV N− U−) (depicted in black) were used as target cells with the FACS-based infected-cell elimination assay (A to C) or the luciferase assays (D to F). (A and D) ADCC responses detected with the anti-Env Abs A32, PGT126, and 3BNC117 against cells infected with the WT virus. (B, C, E, and F) ADCC responses detected with A32 (B and E) or HIV+ and HIV− sera (C and F) against cells infected with WT or N− U− viruses. All graphs shown represent ADCC responses obtained from at least 5 independent experiments. For the FACS-based assay, MAbs were used at 5 μg/ml and human sera were used at a 1:1,000 dilution. For the luciferase assay, area under the curve (AUC) values were calculated using increased concentrations of MAbs (0.0024, 0.0098, 0.0390, 0.1563, 0.6250, 2.5, and 10 μg/ml) and increased dilutions of human sera (1:100, 1:400, 1:1,600, 1:6,400, 1:25,600, and 1:102,400). Error bars indicate means ± standard errors of the means. Statistical significance was tested using unpaired t test or Mann-Whitney test (*, P < 0.05; **, P < 0.01; ***, P < 0.001; ****, P < 0.0001; ns, nonsignificant).

