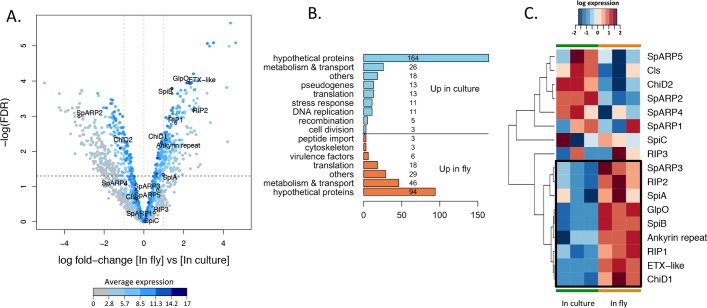
FIG 3 .
(A) Volcano plot of differential gene expression of S. poulsonii in host versus in culture. Each point represents the average value of one transcript in three replicate experiments. The expression difference is considered significant for a log2 fold change of ≥1 (outer light gray broken vertical lines) and for a P value of ≤0.05 [−log(FDR) of ≥1.3, dark broken horizontal line]. Points are colored according to their average expression in all data sets. Names and outlined points represent virulence factors. FDR, false-discovery rate. (B) Manual clustering of the transcripts differentially expressed by S. poulsonii in the fly versus in the culture. The numbers of sequences in the different categories are indicated on the bars or to the right of the bars. (C) Heatmap of S. poulsonii virulence gene expression. Each column represents the value for one replicate experiment in culture or in the fly. The colors represent the log10 level of expression in the corresponding experiment. The cluster of genes that are induced when S. poulsonii is in the host (versus in vitro) is shown enclosed in a black box. SpARP5, S. poulsonii ARP5.

