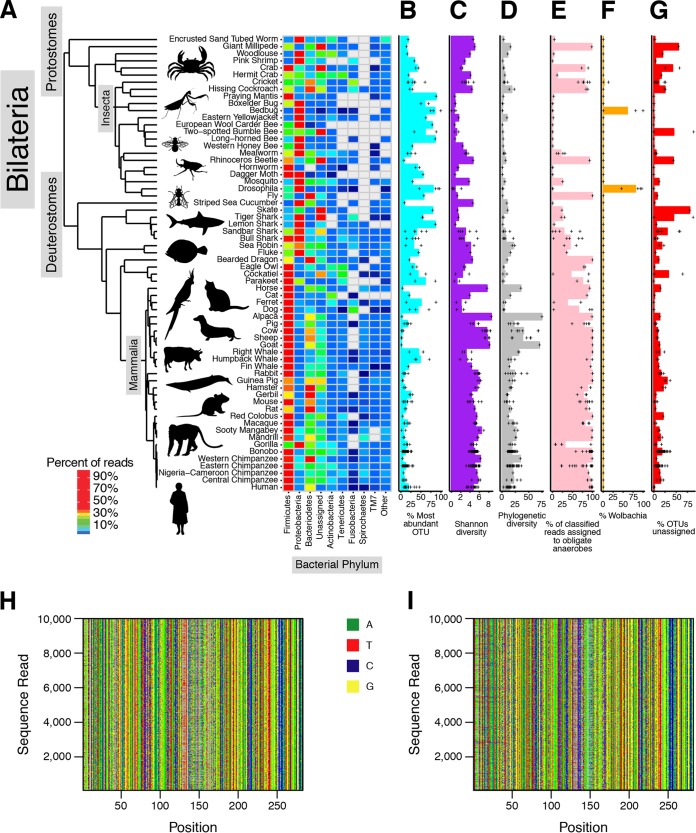
FIG 1 .
Gut microbiota of the Bilateria. The figure summarizes several forms of analysis of the 16S rRNA gene tag sequence data. Host species are indicated by their common names—formal genus and species designations are in Table S1. (A) The proportional abundance of the most abundant bacterial phyla averaged by species. (B) Bar graphs summarizing the percentages of reads assigned to the proportionally most abundant OTU in each species. The values were averaged for each species (bar), and values for individual samples are indicated by plus (+) symbols (the graph format repeats in panels C to G). (C) Bar graph summarizing Shannon diversity for the microbial communities of the various species. (D) Bar graph summarizing phylogenetic diversity for the microbial communities of the various species. (E) Bar graph summarizing the proportion of annotated obligate anaerobic bacteria for the various species. (F) Bar graph summarizing the percentages of reads annotated as Wolbachia for the various species. (G) Bar graphs summarizing the percentages of OTUs that were unable to be assigned to references in the Greengenes database. (H and I) Alignments of a 10,000-read random subset of assigned (H) and unassigned (I) sequence reads showing positions with greater than 10% non-gap sequences, emphasizing that the unassigned reads resemble the assigned reads in sequence.

