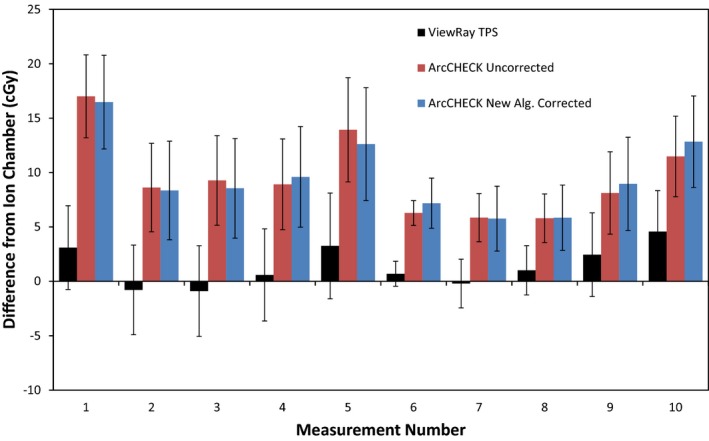
Figure 8.

Bar graph depicting differences between ion chamber measurement and ViewRay TPS calculation (black), uncorrected ArcCHECK measurement (red), and ArcCHECK measurement corrected with new algorithm. Error bars are representative of total k = 1 measurement uncertainty, derived using the uncertainty budget in Table 1.
