
Figure 6.
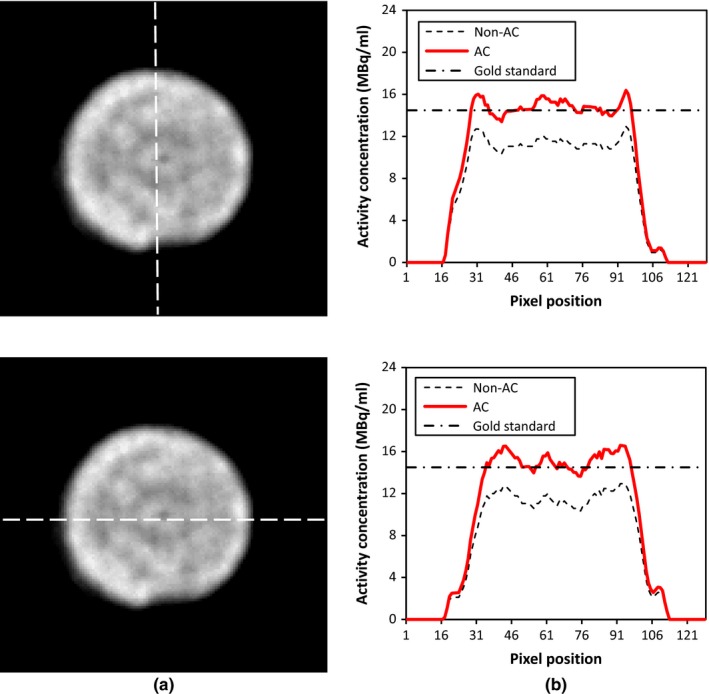
(a) Transverse slice of uniform region and (b) vertical and horizontal line profiles. AC: attenuation corrected, Gold standard: measured with the dose calibrator.
Official websites use .gov
A
.gov website belongs to an official
government organization in the United States.
Secure .gov websites use HTTPS
A lock (
) or https:// means you've safely
connected to the .gov website. Share sensitive
information only on official, secure websites.
(a) Transverse slice of uniform region and (b) vertical and horizontal line profiles. AC: attenuation corrected, Gold standard: measured with the dose calibrator.