
Figure 3.
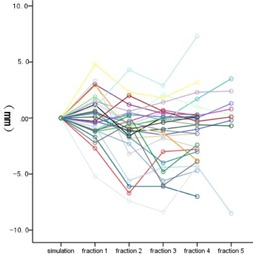
The interfractional variation of ITV centroid position in SI direction. Each color represents the interfraction variation of tumor position of one patient with elapsed time. The ITV centroid position of simulation was used as reference.
Official websites use .gov
A
.gov website belongs to an official
government organization in the United States.
Secure .gov websites use HTTPS
A lock (
) or https:// means you've safely
connected to the .gov website. Share sensitive
information only on official, secure websites.
The interfractional variation of ITV centroid position in SI direction. Each color represents the interfraction variation of tumor position of one patient with elapsed time. The ITV centroid position of simulation was used as reference.