
Figure 7.
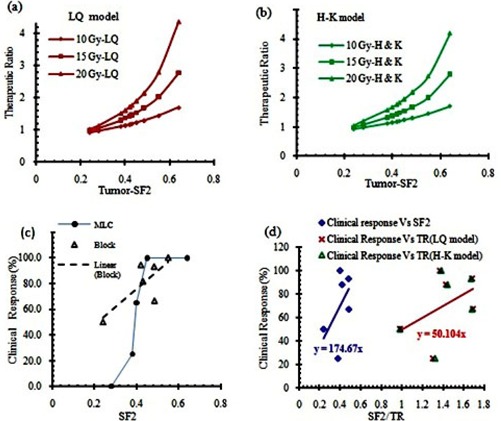
Comparison between therapeutic ratios as a function of the tumor survival fraction at 2 Gy dose (SF2), using LQ model (a) and H‐K model (b); clinical response of different tumors as a function of SF2 for blocked grid (open symbol) and MLC (solid symbol) (c). Clinical response of grid therapy from publications vs. calculated TRs and tumors SF2 value (d).