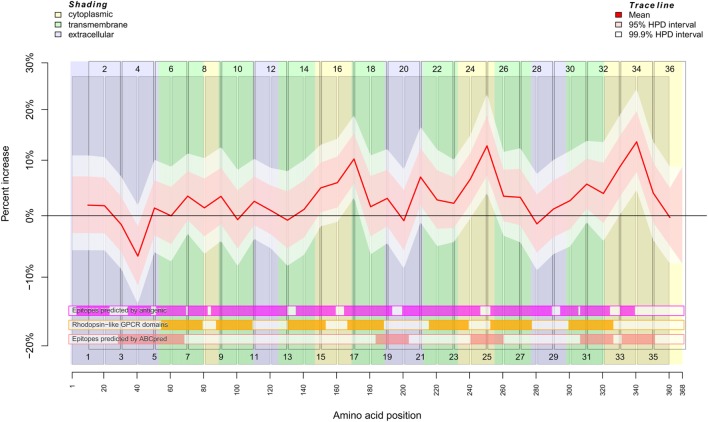
Figure 1.
Binding behavior of SSc patient and healthy control sera to individual peptides. Plot of the mean expectation value (red line) and 95 and 99.9% credibility bands (pink and white shading) of the SSc patient-specific ab-binding signal (percent increase). The x axis represents amino acid residues 1–368. The peptide localizations are indicated by staggered rectangles that include the peptide numbers. The percent increase indicates the increase or decrease of the binding signal in SSc patients in contrast to an averaged signal. If the 95% (99.9%) credibility interval of the percent increase does not include the zero value (black line), the corresponding peptide is regarded as an epitope that is significantly associated with SSc. By use of the ar1 model, the percent increase, i.e., the binding signal estimator, for a peptide is influenced by the neighboring peptides. Other fixed and random effects of the statistical model are shown in Figures S2 and S3 in Supplementary Material. At the bottom, three heat maps indicate the position of putative epitopes predicted by antigenic (magenta hue), ABCpred (pink hue) and the presence of rhodopsine-like domains (orange hue). The background colors indicate the position of intracellular (yellow hue), transmembranous (green hue), or extracellular (blue hue) amino acid residues.

