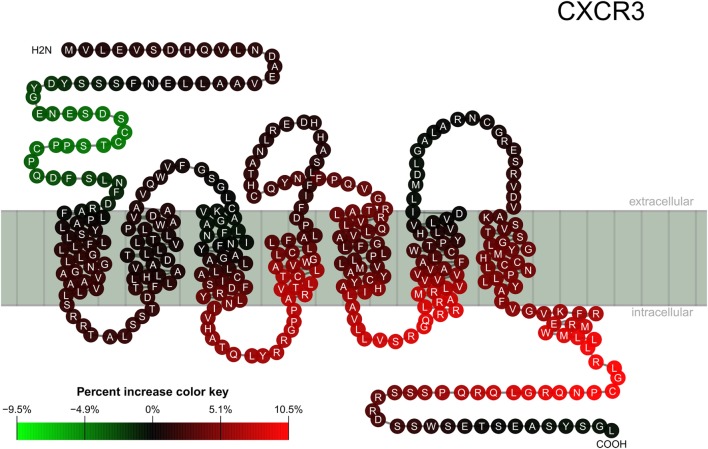
Figure 2.
Location of epitopes on the CXCR3 structure. Mapping of binding signal (compare Figure 1) of SSc patient sera to a serpentine model of CXCR3. Each pearl represents a single amino acid residue, the letter inside each pearl the amino acid in 1-letter code. The color of each pearl indicates the percent increase value of the SSc specific binding signal associated with the respective amino acid residue (color key).

