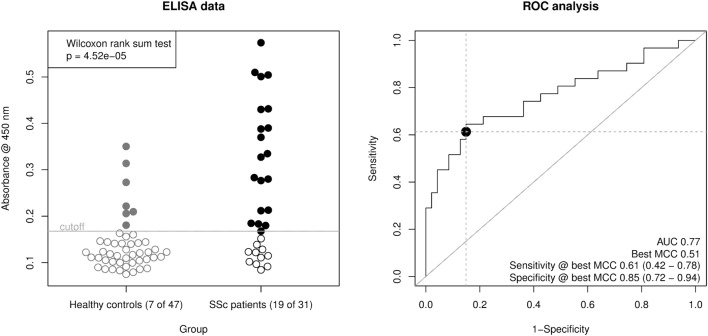
Figure 3.
Derivation of a mixed-peptide ELISA for the discrimination of SSc patients and healthy controls. Peptides 17, 24, 25, 33, and 34 were mixed for coating of ELISA plates. In total, 32 SSc patient sera and 47 healthy control sera were measured. Left panel, scatter plot of raw ELISA readout values (OD @ 450 nm) including a cut-off value optimized by maximization of Matthew’s correlation coefficient. SSc patient showed a significantly higher ELISA signal than healthy control sera (Wilcoxon rank sum testing p = 4.52 × 10⁻⁵). Right panel, receiver operator characteristic (ROC) analysis of ELISA values. AUC (area under curve, 0.77) and best MCC (Matthew’s correlation coefficient, 0.51) as well as Sensitivity (0.61) and Specificity (0.85) at the optimal cut-off are shown as performance indicators. The dot indicates the optimal cut-off position in the ROC curve.

