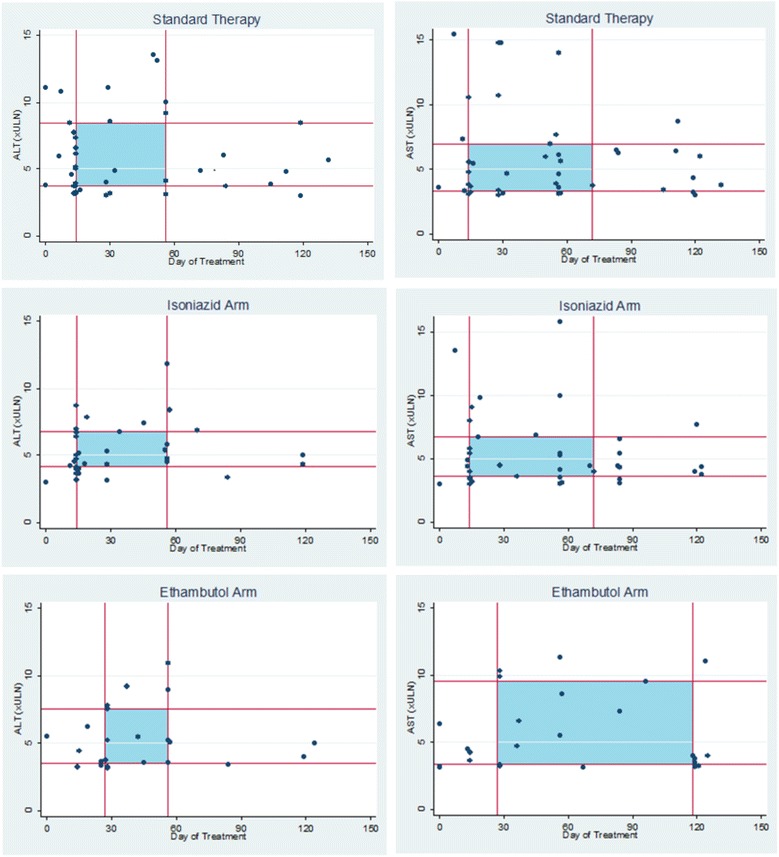
Fig. 2.

Scatter plots illustrating peak values for ALT and AST in patients when peak value ≥3 × ULN. The timing in days since the first treatment dose (x-axis) and peak ALT and AST (y-axis) is illustrated for each treatment arm for those patients with a peak ≥3 × ULN. The lines on the graphs indicate the interquartile ranges for the peak ALT and AST and the timing of the peak in this subgroup, with shaded areas corresponding to the interquartile range for both time and elevation result. Four patients excluded with ALT > 19 × ULN and six patients were excluded with AST >21 × ULN. ALT alanine aminotransferase, AST aspartate aminotransferase, ULN upper limit of normal
