
Fig. 3.
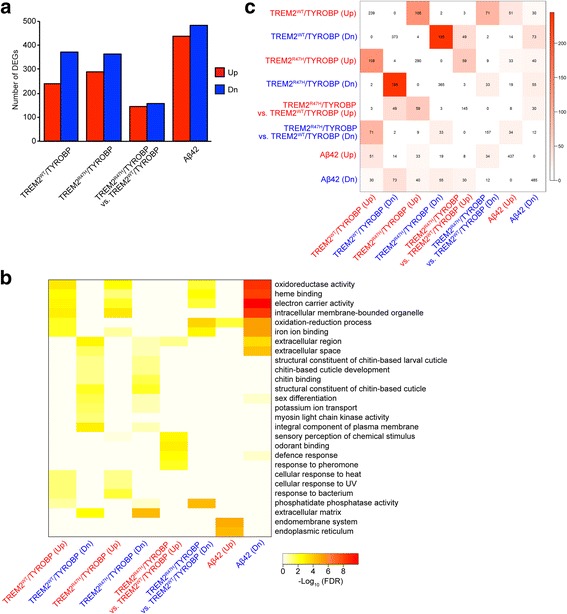
Molecular pathways affected by neuronal expression of Aβ42 overlap with those affected by glial TREM2/TYROBP. a Number of DEGs. The numbers of upregulated genes are indicated in red and the numbers of downregulated genes are in blue. b Heatmap showing the top functional pathways enriched in the DEGs identified in (a). The heatmap color intensity denotes the statistical significance of the enrichment (FDR at minus log 10 scale). c Overlaps among DEGs identified in (a). The number in each cell indicates the number of common DEGs between row and column variables, with color intensity indicating the FDR adjusted p value at minus log 10 scale. Genotypes of flies are described in Additional file 2: Table S1