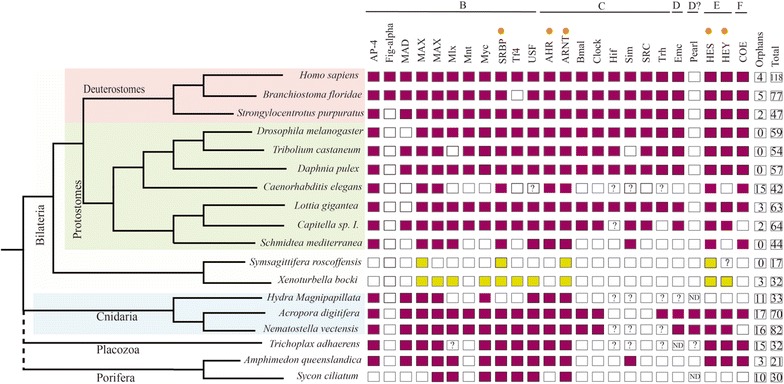
Fig. 2.

Families from bHLH group B–F present in different species from several animal clades. The gene orthologs with neurogenic role in other metazoan lineages are indicated with an orange dot. Colored boxes indicate the presence of the family in that species, while empty boxes indicate their absence. The families from Xenacoelomorpha species are showed with in green. Question marks inside boxes represent the presence of a family member in need of further confirmation (additional gene features). The two last columns represent the number of orphans and the total number of bHLH genes in each selected species (from all the groups from A to F). The image allows us to identify the losses produced in the different clades over evolutionary time.. The data for X. bocki and S. roscoffensis are derived from our previous analysis [11]. Reference species used here are: H. sapiens, N. vectensis, Daphnia pulex, Caenorhabditis elegans, Tribolium castaneum, Lottia gigantean, Branchiostoma floridae, Amphimedon queenslandica, Strongylocentrotus purpuratus, Capitella sp. I., D. melanogaster and H. magnipapillata, all derived from the study of [25]; the data of Schmidtea mediterranea was from [33]; the data from A. digitifera (plus the latest identifications in N. vectensis) and Trichoplax adhaerens were obtained from [32, 34]; the Sycon ciliatum data were from [35]
