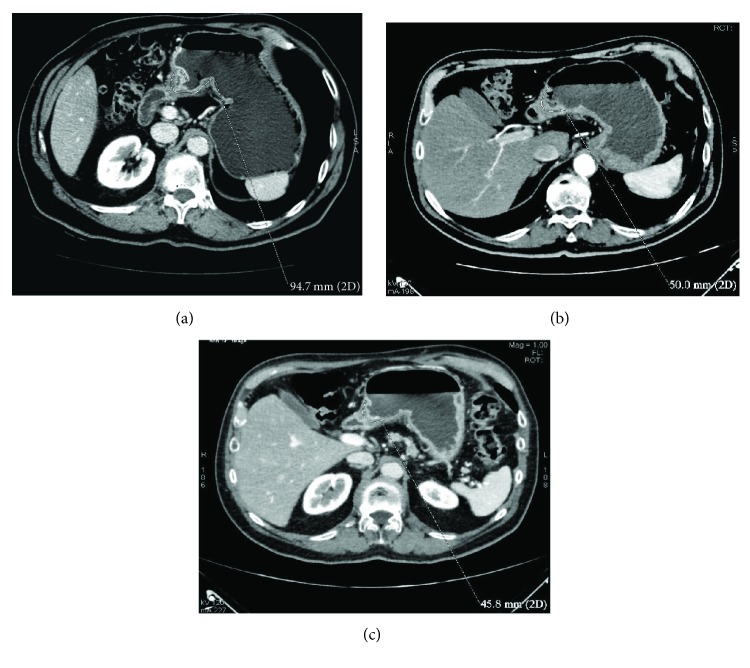
Figure 10.
(a–c) Comparison between staging CT (a), intermediate (b) and presurgical (c) CTs in a 71-year-old man with GC (intestinal histotype) located in the antrum and body, along the lesser curvature. It was clear how D-max reduction rate was greater after 2 cycles of chemotherapy ((a) versus (b), 47.2%) than in the remainder of the treatment ((b) versus (c), 10%).

