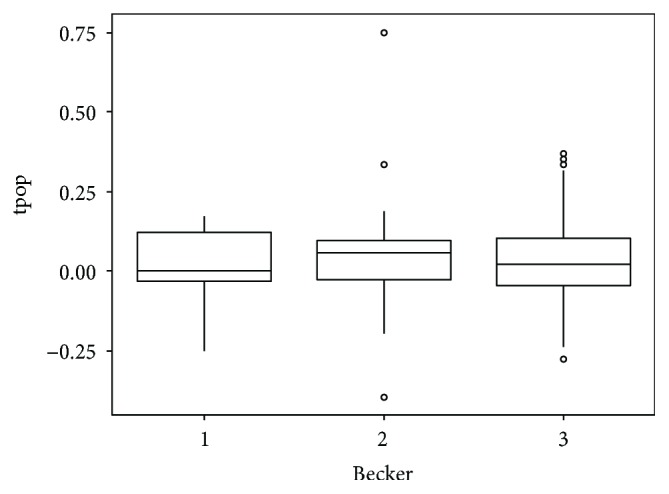
Figure 8.

Box plot showing Hounsfield unit (HU) analysis. HUs were normalised through the ratio between the lesion and aorta HU. Values in the y-axis were obtained from the ratio between HU before and after NAC, whereas values in the x-axis show the Becker grade.
