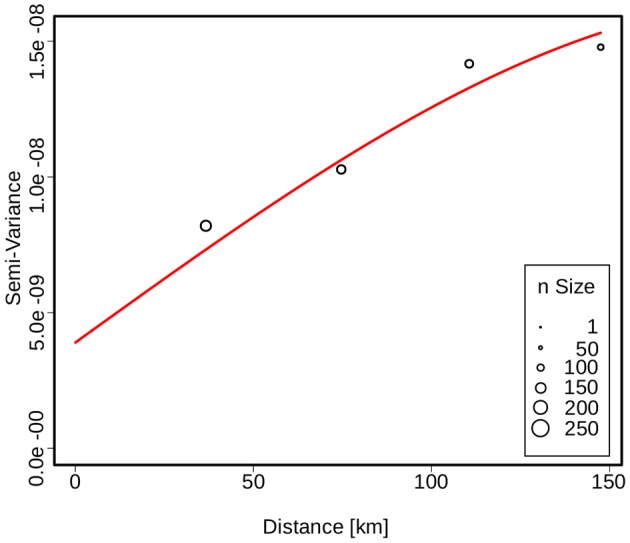
Figure 3.

Semivariogram showing the spatial dependence of the genetic similarity between two strains as a function of distance. The size of the circles is proportional to the number of strains used for variance calculation. The red line indicates the fit of the spherical model used to describe the spatial structure.
