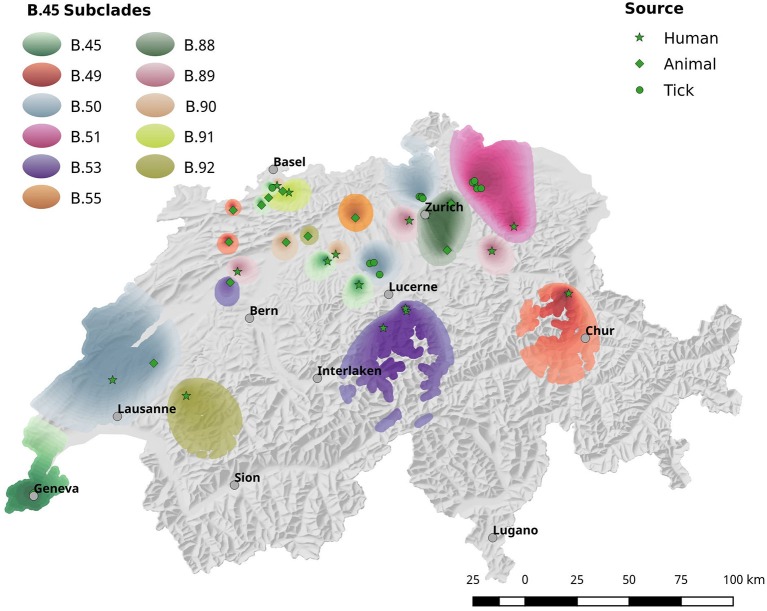
Figure 4.
Spatial interpolation of phylogenetic clusters by krigin. Due to the high genetic diversity of Fth, the geographic distribution of the strains is shown in two separate maps. This Figure shows the interpolated distribution of the B.45 subclades. Figure 5 comprises the data for subclades B.33, B.86 and B.46.

