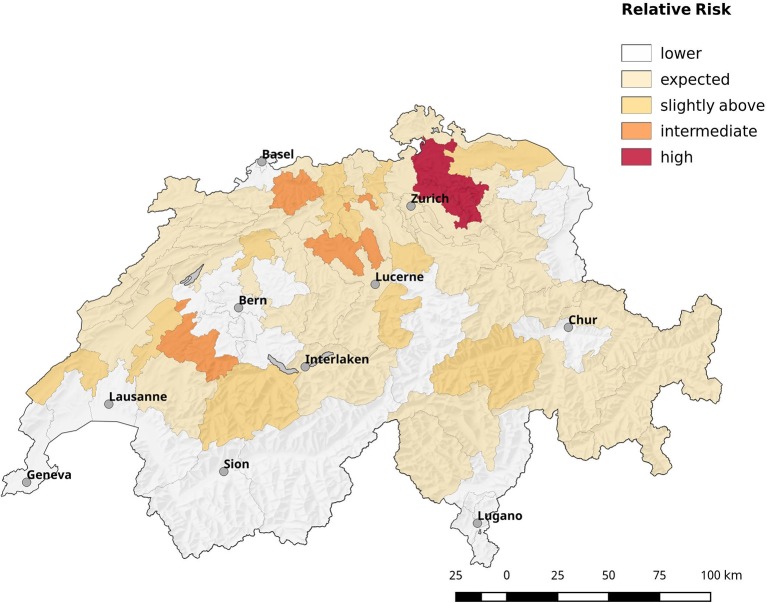
Figure 9.
Spatial distribution of cases by postal code area (first two digits). The estimated relative risk is shown, which is defined by the ratio of observed cases to expected ones. Most areas have less cases than expected, e.g., the relative risk is below 1 (blank zone). The remaining areas are shaded from orange to red according to their relative risk value.

