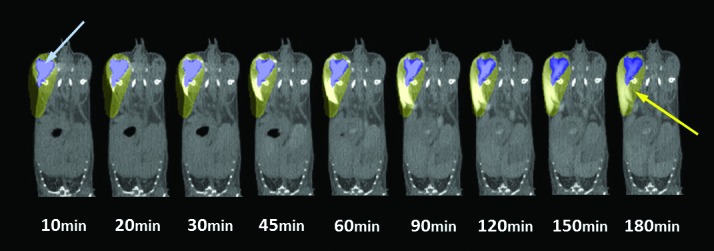
Figure 1.

Region of interest (ROI) analysis. To quantify intramuscularly injected iohexol leakage from the injection site over time, 3D ROI were drawn for each mouse over the initial injection volume (blue arrow; blue ROI) at the beginning of the scan (10-min time point) and for the full pelvic limb region (yellow arrow; yellow ROI) at the end of the scan (180-min time point), to ensure that any leakage from the injection site over time is accounted for. For the purposes of this analysis, the volume of the yellow pelvic limb ROI does not include that of the blue, initial injection volume ROI. ROI were applied to each time point in the series, and average HU intensity in the pelvic limb ROI was determined for the duration of the study. The leakage of intramuscularly injected iohexol from the initial injection site over time is associated with increasing average HU intensity in the pelvic limb (yellow) ROI over time.
