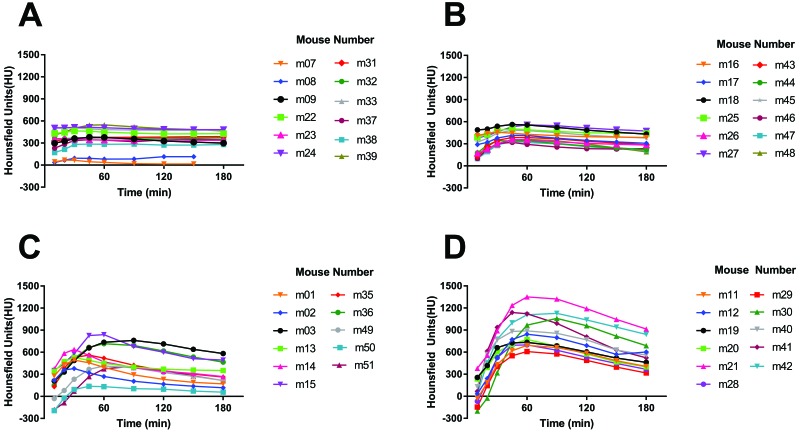
Figure 4.
These graphs depict the mean HU intensity in the pelvic limb ROI over time. Leakage of HU-intense iohexol from the initial intramuscular injection site is measured as increases in the mean HU intensity in the surrounding pelvic limb ROI over time. In the (A) 25-µL and (B) 50-µL injection groups, iohexol remains nearly exclusively intramuscularly at the injection site, as indicated by the relative lack of measureable increases in mean HU intensity into the surrounding pelvic limb ROI over time. In the (C) 100-µL and (D) 200-µL injection groups, considerable iohexol leakage from the initial injection site into the surrounding pelvic limb ROI is apparent.

