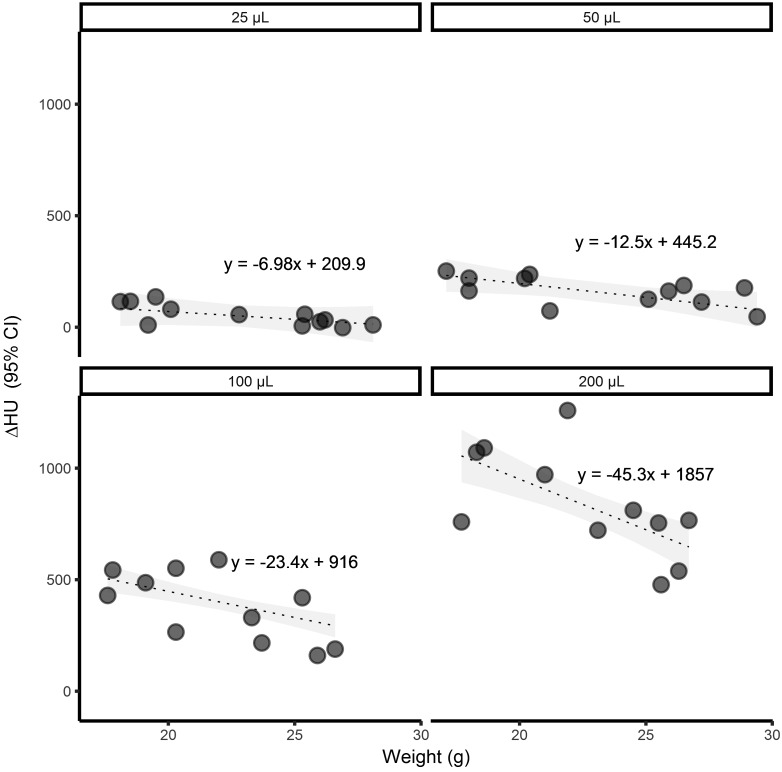
Figure 5.
Effect of weight on change in pelvic limb ROI intensity according to injection volume. Dashed lines indicate level curves of the regression model Y = β1 × weight + β2 volume + β3 × weight × volume + α. The interaction between weight and volume effects is significant (P = 0.0054). The slope of the level curves decreased by an estimated 2.2 HU/g (95% CI, 0.68 to 3.70) for each 10-µL increase in the injected volume.

