
Figure 1.
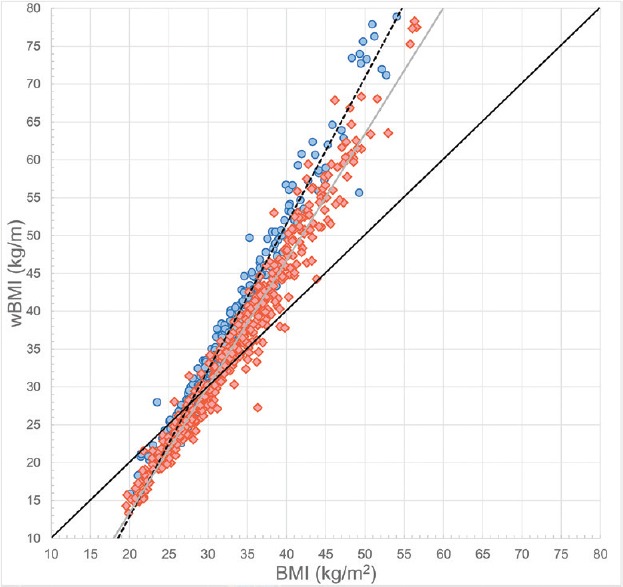
The relationship between body mass index and waist-corrected body mass index stratified by gender. Men and women are represented by blue dots and red diamonds, respectively. The black continuous line represents the mathematical equation f(x) = x. The black dotted and gray lines represent the trend lines for men and women, respectively