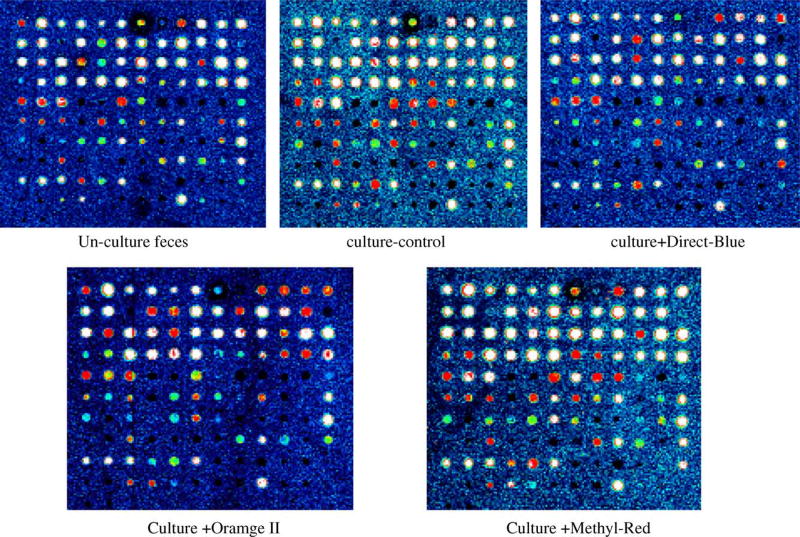
Fig. 1.
Microarray test results for cultured feces with azo dyes and the same control fecal sample without culture (un-culture feces) or after culture (culture-control). The position of the oligo probes on the array from top-left to the right-bottom are 1–120, 12 per lane total 10 lanes. The probe number and the corresponding bacterial species are listed in Table 1. The positive signal intensities from strongest to weakest are white, red, yellow, green and blue (see web version for color picture).

