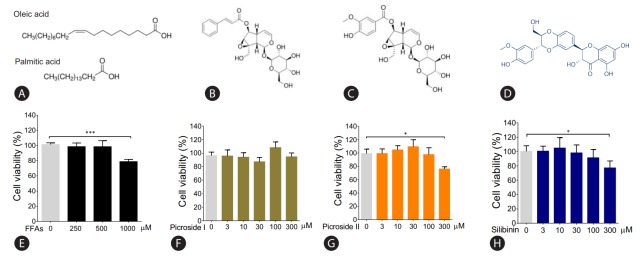
Figure 1.
Cytotoxic effect of FFAs and picroside I and II in HepG2 cells: The chemical structure of FFAs (A), picroside I (B), picroside II (C) and silibinin (D). HepG2 cells were loaded with different concentrations of FFAs (E), picroside I (F), picroside II (G), and silibinin (H) for 24 hours. Cytotoxicity was measured via MTT assay. Values are expressed as mean±SEM from four independent replicates. FFAs, free fatty acids; SEM, standard errors of mean. * P<0.05; ***P<0.001.

