
Figure 5.
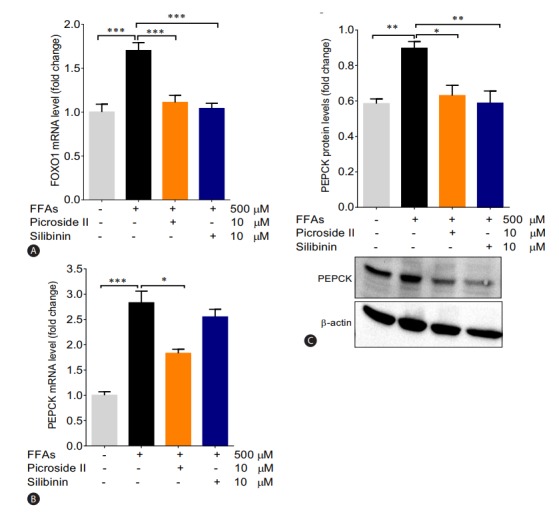
Picroside II decreases the expression of gluconeogenic genes: HepG2 cells were pretreated with picroside II and silibinin at a concentration of 10 μM 2 hours prior to FFA (500 μM) loading for 20 hours followed by RT-PCR analysis of FOXO1 (A), PEPCK (B), and Western blot analysis of PEPCK (C). Values are expressed as mean±SEM from four independent replicates. FFAs, free fatty acids; RT-PCR, reverse transcription polymerase chain reaction; FOXO1, forkhead box protein O1; PEPCK, phosphoenolpyruvate carboxykinase; SEM, standard errors of mean. * P<0.05; **P<0.01; ***P<0.001.