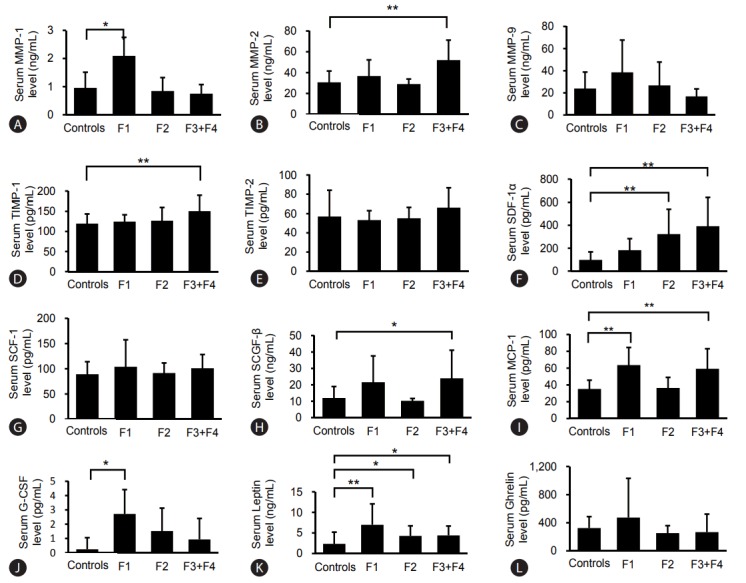
Figure 2.

Serum levels of MMPs, TIMPs, and cytokines in NASH patients by fibrosis stage compared with those in healthy controls. Serum levels of MMP-1 (A), MMP-2 (B), MMP-9 (C), TIMP-1 (D), TIMP-2 (E), SDF-1α (F), SCF-1 (G), SCGF-β (H), MCP-1 (I), G-CSF (J), Leptin (K), Ghrelin (L). The numbers of patients were as follows: F1 NASH group (n=14), F2 NASH group (n=10), F3+F4 NASH groups (n=9), and healthy controls (n=14). The serum MMP-1 levels in fibrosis stage 1 (F1 group) were higher (P<0.01), the serum MMP-2 levels in the F4 group were higher (P<0.01), the serum levels of TIMP-1 in the F4 group were also significantly higher than those in healthy controls (P<0.01). Serum levels of SDF-1α were significantly higher in the F2, F3 and F4 groups. Serum levels of G-CSF in the F3 group were statistically higher than in healthy controls. Serum levels of MCP-1 and serum levels of leptin in the F1 group were statistically higher compared with healthy controls. F, fibrosis; MMP, matrix metalloproteinase; TIMP, tissue inhibitors of metalloproteinase; SDF, stromal cell-derived factor; SCF, stem cell factor; SCGF-β, stem cell growth factor-β; MCP, monocyte chemotactic protein; G-CSF, granulocyte-colony stimulating factor; NASH, nonalcoholic steatohepatitis. Statistical significance: *P<0.05, **P<0.01.
