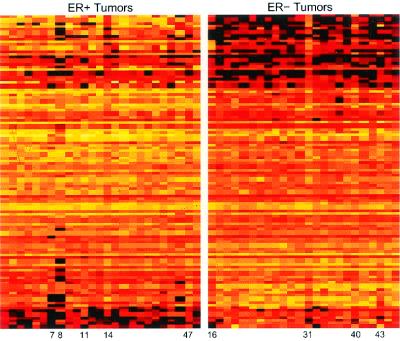
Figure 2.
Expression levels of top 100 genes providing pure discrimination of ER status. Expression levels are depicted by color coding, with black representing the lowest level, followed by red, orange, yellow, and then white as the highest level of expression. Each column in the figure represents all 100 genes from an individual tumor sample, which are grouped according to determined ER status. Each row represents an individual gene, ordered from top to bottom according to regression coefficients (see Table 3).

