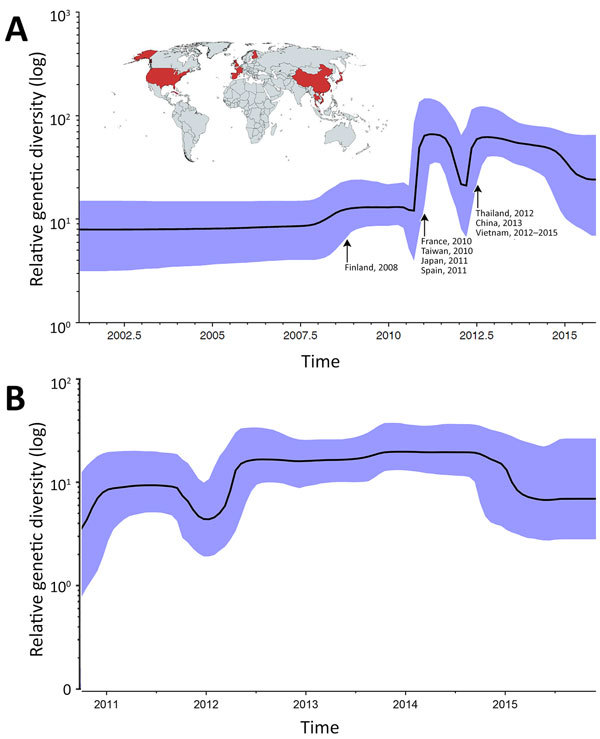
Figure 4.

Skyline plots depicting the relative genetic diversity of CV-A6 over time. A) Result obtained from the analysis of viral capsid protein 1 sequences of global strains; B) result obtained from the analysis of complete coding sequences of Vietnam strains. Blue shading indicates 95% highest posterior density interval. Arrows in panel A indicate worldwide CV-A6 outbreaks and associated fluctuations in relative genetic diversity ; map (obtained from https://mapchart.net) illustrates the countries in which CV-A6–associated HFMD outbreaks have been recorded to date (3). No sequences from Cuba, Singapore, or the United States fulfilled the selection criteria for the skyline plot and phylogenetic analyses (see Methods section). CV, coxsackievirus.
